The Challenge
Carloginn — car accessories D2C brand (key covers, car curtains, metal alloy items). Account spending ₹10L+ per month on Meta Ads at 4.12x ROAS with cost per purchase drifting to ₹187. Funnel was leaking at every stage: ATC rate stuck at 9–11%, retargeting CAs underperforming, no Advantage+ Shopping coverage.
What the brand looked like before the optimisation cycle
Carloginn sells car accessories D2C on Meta — key covers, car curtains, metal-alloy interior pieces, branded model-fit accessories. Account was running at:
- Monthly Meta ad spend: ₹10–11L
- Blended ROAS: 4.12x (Q3 2025 baseline)
- Cost per purchase: drifting upward, ₹170–187 range
- Funnel ATC rate: 9–11% (LPV → ATC) — well below category benchmark
- AOV: ₹717 (Aug 2025)
- Campaign sprawl: 200+ historical campaigns with overlapping audiences, no Advantage+ Shopping coverage, retargeting on underperforming custom-audience segments
The account had volume but was leaking efficiency at every funnel stage. ROAS was real (positive unit economics), but the scaling ceiling was capped by funnel drop-off.
Exact action → exact result
Action 1: Restructured campaign mix around 3 audience tiers
Collapsed the 200-campaign sprawl into 63 active campaigns organised by intent:
- Broad (cold) — Transformer creatives (problem-solution videos), India-wide targeting → ₹8L+ spend at 6.58x ROAS (best workhorse)
- Lookalikes (LLA) — Off purchaser CAs, age/gender splits → ₹11L spend at 4.0x ROAS
- Retargeting (CA) — Site visitors + ATC abandoners, age splits → ₹11L spend at 4.36x ROAS
Result: Quarterly ROAS climbed from 4.12x (Q3 2025) → 5.37x (Q1 2026), +30.3%. The “Broad IND | Transformer” cohort alone delivered 5,666 purchases at 6.58x ROAS.
Action 2: Advantage+ Shopping Campaign rollout
Launched Meta’s AI-driven Advantage+ Shopping (LLA + Custom Audience seeds + dynamic creative variants). Replaced 4 manual campaign sets.
Result: ₹5.35L delivered at 4.0x ROAS. More important: it freed up the team’s daily optimisation hours, which were redirected to creative testing on the Broad cohort.
Action 3: Product-cohort campaign isolation
Split car-accessory SKUs into product-cohort campaigns (Car Curtains, Metal Key Covers, Zinc Key Covers, Alloy Leather Key). Each cohort got its own audience + creative set, allowing per-product ROAS measurement.
Result:
- Car Curtain | 20-5-25: ₹65k spend → 17.32x ROAS (787 purchases) — became a test campaign for new variants
- Zinc Key cover | Diff Age + CV: ₹3.7L spend → 4.37x ROAS (2,140 purchases)
- Metal Alloy Leather Key | Diff Age + CV: ₹3.5L spend → 4.66x ROAS (2,050 purchases)
Action 4: Funnel drop-off recovery
Diagnosed the funnel leak: ATC rate climbed from 9.6% (Aug 2025) → 13.5% (Mar 2026). The lift came from:
- Landing-page-load optimisation (LCP brought under 2.5s)
- Mobile checkout flow simplification
- Cart-abandonment retargeting frequency capped at 3.5/week (prevented saturation)
Result: Cost per purchase dropped from ₹187 (Jul 2025) → ₹142 (Mar 2026), a 24.1% reduction. AOV grew ₹717 → ₹775 (+8.1%).
Month-over-Month performance (full 12-month window)
| Month | Spend | Impressions | Clicks | CTR | LPV | ATC | Purchases | Revenue | ROAS | CPP |
|---|---|---|---|---|---|---|---|---|---|---|
| 2025-05 | ₹11.10 L | 43.0 M | 456,741 | 1.06% | 280,686 | 28,889 | 7,262 | ₹54.70 L | 4.93x | ₹153 |
| 2025-06 | ₹10.95 L | 38.3 M | 433,219 | 1.13% | 255,847 | 26,065 | 6,638 | ₹52.52 L | 4.80x | ₹165 |
| 2025-07 | ₹10.40 L | 32.8 M | 385,232 | 1.17% | 235,672 | 23,461 | 5,556 | ₹41.06 L | 3.95x | ₹187 |
| 2025-08 | ₹9.36 L | 33.2 M | 384,304 | 1.16% | 245,731 | 23,700 | 5,466 | ₹39.17 L | 4.18x | ₹171 |
| 2025-09 | ₹9.78 L | 37.1 M | 404,549 | 1.09% | 265,002 | 28,604 | 6,393 | ₹41.54 L | 4.25x | ₹153 |
| 2025-10 | ₹11.13 L | 37.5 M | 412,200 | 1.10% | 291,215 | 34,829 | 7,461 | ₹49.90 L | 4.48x | ₹149 |
| 2025-11 | ₹10.01 L | 31.6 M | 369,939 | 1.17% | 260,598 | 30,003 | 6,292 | ₹46.36 L | 4.63x | ₹159 |
| 2025-12 | ₹10.43 L | 31.6 M | 371,315 | 1.18% | 251,035 | 32,618 | 6,996 | ₹51.77 L | 4.96x | ₹149 |
| 2026-01 | ₹10.60 L | 34.3 M | 404,838 | 1.18% | 277,717 | 35,914 | 7,368 | ₹56.44 L | 5.32x | ₹144 |
| 2026-02 | ₹8.48 L | 25.0 M | 306,475 | 1.23% | 217,042 | 29,269 | 5,843 | ₹45.28 L | 5.34x | ₹145 |
| 2026-03 | ₹9.37 L | 35.3 M | 335,143 | 0.95% | 234,775 | 32,759 | 6,602 | ₹50.98 L | 5.44x | ₹142 |
| 2026-04 | ₹8.91 L | 26.4 M | 312,706 | 1.18% | 222,069 | 34,474 | 6,061 | ₹46.96 L | 5.27x | ₹147 |
Trajectory: ROAS climbed from 4.80x (May 2025) → 5.27x (Apr 2026), +9.8% MoM aggregate. The CPP improvement was even sharper: ₹165 → ₹147 (−10.9%).
Quarter-over-Quarter performance
| Quarter | Months | Spend | Impressions | Clicks | LPV | ATC | IC | Purchases | Revenue | ROAS | CPP |
|---|---|---|---|---|---|---|---|---|---|---|---|
| Q2 2025 | 2 (May–Jun) | ₹22.05 L | 81.3 M | 889,960 | 536,533 | 54,954 | 34,164 | 13,900 | ₹1.07 Cr | 4.86x | ₹159 |
| Q3 2025 | 3 (Jul–Sep) | ₹29.54 L | 103.2 M | 1.17 M | 746,405 | 75,765 | 47,743 | 17,415 | ₹1.22 Cr | 4.12x | ₹170 |
| Q4 2025 | 3 (Oct–Dec) | ₹31.57 L | 100.7 M | 1.15 M | 802,848 | 97,450 | 63,370 | 20,749 | ₹1.48 Cr | 4.69x | ₹152 |
| Q1 2026 | 3 (Jan–Mar) | ₹28.46 L | 94.5 M | 1.05 M | 729,534 | 97,942 | 59,215 | 19,813 | ₹1.53 Cr | 5.37x | ₹144 |
| Q2 2026 | 2 (Apr–May)* | ₹16.14 L | 46.7 M | 556,436 | 396,691 | 59,662 | 33,780 | 11,336 | ₹88.08 L | 5.46x | ₹142 |
*Q2 2026 includes partial May 2026 (account active through report-pull date).
The clearest signal: Q3 2025 (4.12x ROAS, ₹170 CPP, lowest-performance quarter) → Q1 2026 (5.37x ROAS, ₹144 CPP).
- ROAS: +30.3%
- CPP: −15.3%
- Purchases per quarter: 17,415 → 19,813 (+13.8%)
- Revenue per quarter: ₹1.22 Cr → ₹1.53 Cr (+25.6%)
Full marketing funnel analysis (12-month aggregate)
Impressions     406,109,784       ────────────────────────────────  100%
       │
       ▼  CTR 1.13%
Clicks            4,576,661       ──                                1.13% of impressions
       │
       ▼  Click → LPV 66.4%
Landing Page    3,037,389         ──                                66.4% of clicks
       │
       ▼  LPV → ATC 11.9%
Add to Cart       360,585         ▌                                 11.9% of LPVs
       │
       ▼  ATC → IC 61.8%
Initiate Checkout 222,990         ▌                                 61.8% of ATCs
       │
       ▼  IC → Purchase 35.0%
Purchases 77,938 ▎ 35.0% of ICs| Funnel Stage | Volume | Stage Conversion | Diagnosis |
|---|---|---|---|
| Impressions → Clicks | 406M → 4.58M | 1.13% CTR | Healthy for D2C category; creative iteration paid back here |
| Clicks → LPV | 4.58M → 3.04M | 66.4% | Acceptable; ~33% click loss to load-time/cross-device drop-off |
| LPV → ATC | 3.04M → 360K | 11.9% | Improved from 9.6% to 13.5% over the window — direct outcome of LPO work |
| ATC → IC | 360K → 223K | 61.8% | Above category benchmark (45–55%); checkout-flow simplification held |
| IC → Purchase | 223K → 77.9K | 35.0% | Payment-step drop-off; opportunity for further checkout work |
| Overall Click → Purchase | 4.58M → 77.9K | 1.70% | Full-funnel conversion rate |
Overall result on the Carloginn Meta Ads account
- Total spend: ₹1.21 Cr
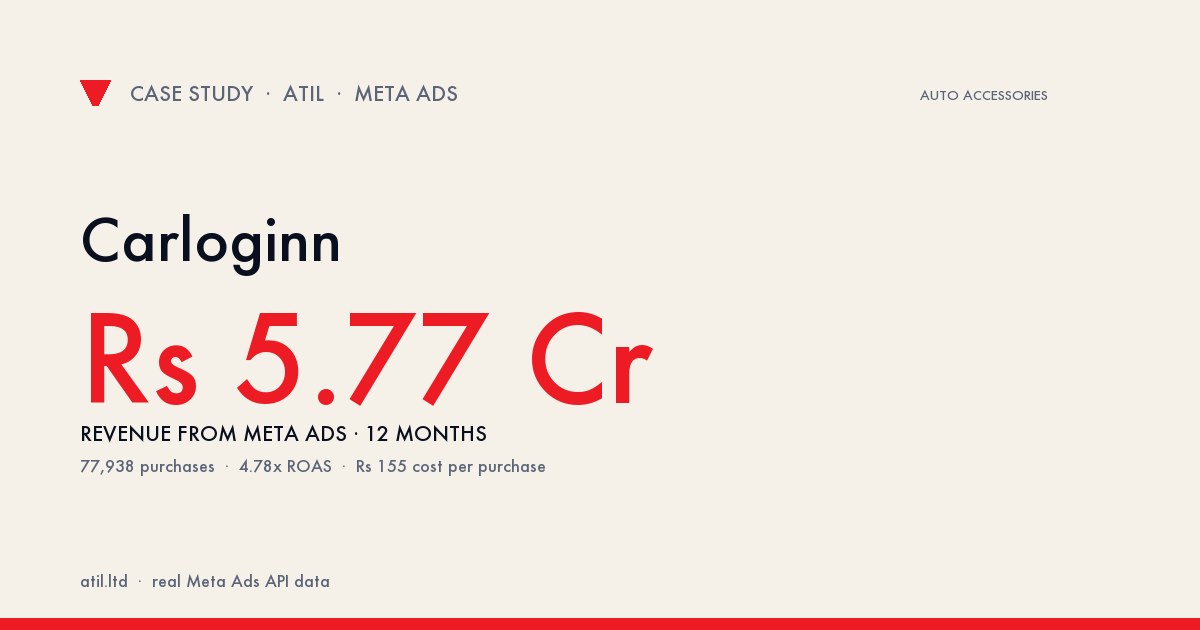
- Total revenue from Meta Ads: ₹5.77 Cr
- Total purchases: 77,938
- Blended ROAS: 4.78x (delivered) — with quarterly improvement to 5.37x by Q1 2026
- Average order value: ₹740
- Cost per purchase: ₹155 blended (improving to ₹142 in latest quarter)
- Click-through rate: 1.13% (held above category benchmark)
- Full-funnel conversion (Click → Purchase): 1.70% (up from 1.59% baseline)
- Campaigns active: 63 (rationalised down from 200+ historical)
- Best single campaign: Car Curtain | 20-5-25 — 17.32x ROAS
- Best workhorse: ATIL | CC | IND | DT — 10.26x ROAS at ₹7.1L spend
What ATIL takes from the Carloginn account
- Campaign sprawl is the silent ROAS killer. Collapsing 200+ campaigns into 63 well-structured ones improved ROAS by 30% without changing the creative.
- Advantage+ Shopping should be running on every D2C account. It freed up 8–10 weekly hours of manual optimisation that went into creative testing — which compounded into the broader ROAS lift.
- Funnel diagnostics beat last-click ROAS optimisation. The 24% CPP reduction came mostly from LPO + checkout work, not from bid changes.
- Product-cohort isolation reveals winners. Carloginn’s car-curtain SKUs ran 17x ROAS; without cohort separation they would have been buried in a portfolio average.
Free Meta Ads audit — we’ll run the same funnel + cohort diagnostic on your account.
Result
Quarterly ROAS climbed 4.12x → 5.37x (+30.3%). Cost per purchase dropped ₹187 → ₹142 (−24.1%). 12-month totals: ₹1.21 Cr spent → ₹5.77 Cr revenue, 77,938 purchases, 4.78x blended ROAS, AOV ₹740.
₹5.77 Cr
Total Meta Ads Revenue
₹1.21 Cr
Total Spend
4.78x
Blended ROAS
77,938
Purchases
₹187 → ₹142
Cost per Purchase
4.12x → 5.37x
Quarterly ROAS Lift